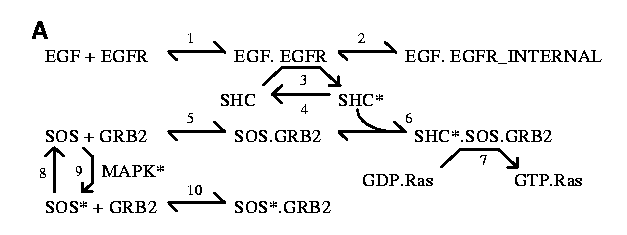
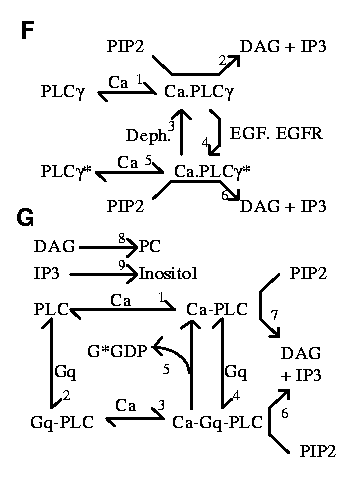
Reactions
Reversible reactions are represented as bidirectional arrows
(e.g., reactions 1 and 2 in the EGFR scheme below) and irreversible
reactions as unidirectional arrows (Reaction 4 in EGFR).
Enzyme reactions are drawn as an arrow
with two bends, where the enzyme is located on the middle segment (Reaction
3 in EGFR). Numbers
for identifying reactions are located on the forward (kf) side of the
bidirectional arrows. For clarity, the same reactant may be represented
multiple times in a given reaction scheme, but it is modeled only as a
single reactant.


The CaM-Kinase model takes into account the fact that the enzyme exists
as an 8 to 12-mer. We compute all autophosphorylation rates as
intra-holoenzyme but inter-subunit rates by treating
autophosphorylations as
zeroth order reactions, i.e., no concentration terms.
The various phosphorylation states of CaMKII have different enzyme
kinetics, and each of these were explicitly modeled. For simplicity the
autophosphorylation steps are represented by a single enzyme arrow
in this figure, with CaMKII_a as the combined activity of the
various phosphorylation states. The individual kinetic terms used in
the model are
indicated by the multiple rate references on the arrows.


NMDA Receptor
The NMDA Receptor was modeled according to De Schutter and Bower 1993
(Reference xxyy) in a
compartmental model of a hippocampal CA1 neuron
which was implemented in GENESIS.
The reaction scheme is as follows:
A + R <---> AR
Kr = 50 uM
AR ---> AR*
tau_g = 283 sec
AR* ---> A + R
tau_d = 0.002 msec
A ---> removal
tau_h = 5.88 msec.
- A is the transmitter
- R is the receptor,
- AR is the closed transmitter-receptor complex,
- AR* is the open transmitter-receptor complex.
AMPA Receptor
The NMDA Receptor was also modeled according to
De Schutter and Bower 1993 (Reference xxyy) in a
compartmental model of a hippocampal CA1 neuron
which was implemented in GENESIS.
The same reaction scheme was used as for the NMDA receptor:
A + R <---> AR
Kr = 2 uM
AR ---> AR*
tau_g = 600 msec
AR* ---> A + R
tau_d = 0.001 msec
A ---> removal
tau_h = 1.25 msec.
Depolarization
The depolarization was computed using a
compartmental model of a hippocampal CA1 neuron
which was implemented in GENESIS.
The Crank-Nicholson implicit integration method was used
(Bhalla, Bilitch and Bower 1993, Hines 198xx xxyy refs).
Regulation of nuclear and cytoskeletal events
These events were not explicitly modeled. Instead, the production
of MKP-1 (which is produced following MAPK induction) was
modeled by raising MKP-1 concentration to various levels for
various durations following tetanic stimulus. See Figure
2 G and H of the original paper.


